
|
Year |
Total
FTEs |
|
2001 |
18,098.53 |
|
2002 |
18,274.36 |
|
2003 |
18,753.06 |
|
2004 |
18,786.88 |
|
2005 |
19,018.22 |
|
2006 |
19,068.89 |
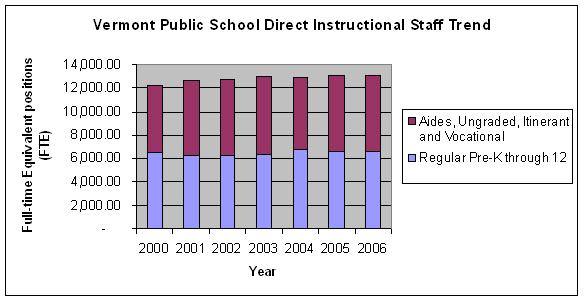
| Direct Instructional Staff | 2000 | 2001 | 2002 | 2003 | 2004 | 2005 | 2006 |
| Preschool/Kindergarten | 72.01 | 62.45 | 66.25 | 71.26 | 75.52 | 81.78 | 76.97 |
| Kindergarten | 301.07 | 302.88 | 313.90 | 332.76 | 321.43 | 337.09 | 343.73 |
| Elementary (Grades 1-6) | 2,891.74 | 2,843.46 | 2,890.90 | 2,848.52 | 3,035.20 | 2,967.91 | 2,942.77 |
| Secondary (Grades 7-12) | 3,279.89 | 3,085.92 | 3,027.96 | 3,114.82 | 3,255.25 | 3,275.70 | 3,263.13 |
| Ungraded | 1,247.80 | 1,405.25 | 1,560.58 | 1,549.40 | 1,766.37 | 1,783.79 | 1,941.75 |
| Teachers Aides | 3,768.11 | 3,927.90 | 3,998.86 | 4,224.07 | 4,213.19 | 4,338.50 | 4,257.99 |
| Vocational Teachers | - | 269.47 | 215.52 | 270.51 | 298.92 | 303.86 | 278.64 |
| Itinerant Teachers | 680.36 | 713.99 | 665.86 | 634.38 | |||
| Total | 12,240.98 | 12,611.32 | 12,739.83 | 13,045.72 | 12,965.88 | 13,088.63 | 13,104.98 |
|
Support
Svcs - Students |
2001 |
2002 |
2003 |
2004 |
2005 |
2006 |
Change |
Change % |
|
Admin.Asst.,
Clerical (2100) |
128.24 |
108.35 |
114.75 |
113.90 |
110.85 |
114.53 |
-13.71 |
-10.7% |
|
Attendance
& Social Work Personnel |
52.90 |
57.62 |
97.58 |
75.85 |
114.07 |
104.66 |
51.76 |
97.8% |
|
Guidance
Counselors/Directors - Elem (Grades pre-1st, 1-6) |
165.04 |
167.30 |
178.75 |
175.50 |
169.37 |
164.48 |
-0.56 |
-0.3% |
|
Guidance
Counselors/Directors - Sec (Grades 7-12) |
227.75 |
230.90 |
240.10 |
250.80 |
257.80 |
265.73 |
37.98 |
16.7% |
|
Nurses |
209.01 |
206.62 |
218.96 |
215.13 |
222.16 |
224.72 |
15.71 |
7.5% |
|
Nurses
Aides |
57.97 |
58.02 |
52.99 |
63.15 |
54.07 |
51.20 |
-6.77 |
-11.7% |
|
Psychological,
Speech Pathology, & Audiology Staff |
279.33 |
298.25 |
293.45 |
309.62 |
344.08 |
358.12 |
78.79 |
28.2% |
|
School
Registrars |
44.59 |
33.06 |
39.71 |
41.44 |
36.13 |
41.15 |
-3.44 |
-7.7% |
|
Support
Svcs - Students Total |
1,164.83 |
1,160.12 |
1,236.29 |
1,245.39 |
1,308.53 |
1,324.59 |
159.76 |
13.7% |
|
Support
Svcs - Instructional Staff |
2001 |
2002 |
2003 |
2004 |
2005 |
2006 |
Change |
Change % |
|
Admin.Asst.,
Clerical (2200) |
50.57 |
53.68 |
88.13 |
44.80 |
57.15 |
45.82 |
-4.75 |
-9.4% |
|
Athletic
Directors |
29.83 |
33.03 |
40.52 |
38.89 |
34.28 |
41.50 |
11.67 |
39.1% |
|
Audiovisual
Staff |
45.37 |
52.55 |
58.76 |
109.77 |
117.88 |
112.37 |
67.00 |
147.7% |
|
Curriculum
Coordinators |
45.30 |
47.87 |
46.99 |
62.61 |
48.28 |
51.26 |
5.96 |
13.2% |
|
EEE
Directors |
13.15 |
12.44 |
15.67 |
14.31 |
13.52 |
14.62 |
1.47 |
11.2% |
|
Librarians |
235.24 |
228.38 |
234.37 |
226.85 |
221.22 |
224.98 |
-10.26 |
-4.4% |
|
School
Library Support Staff |
176.11 |
170.98 |
165.69 |
152.63 |
176.44 |
145.68 |
-30.43 |
-17.3% |
|
Title IX
Coordinators |
3.50 |
0.00 |
4.80 |
3.60 |
0.07 |
2.07 |
-1.43 |
-40.9% |
|
Support
Svcs - Instructional Staff Total |
599.07 |
598.94 |
654.93 |
653.46 |
668.84 |
638.30 |
39.23 |
6.5% |
|
Support
Svcs - School Admin |
2001 |
2002 |
2003 |
2004 |
2005 |
2006 |
Change |
Change % |
|
Admin.
Asst., Clerical (2400) |
528.07 |
515.97 |
581.28 |
575.63 |
606.42 |
596.49 |
68.42 |
13.0% |
|
Assistant
Principals |
109.01 |
108.93 |
118.78 |
113.19 |
120.99 |
125.40 |
16.39 |
15.0% |
|
Bookkeeper |
49.06 |
58.41 |
56.37 |
57.21 |
63.37 |
60.52 |
11.46 |
23.4% |
|
Department
Heads |
82.03 |
67.14 |
92.14 |
61.09 |
67.10 |
75.02 |
-7.01 |
-8.5% |
|
Principals |
311.56 |
310.58 |
313.80 |
328.94 |
314.45 |
318.99 |
7.43 |
2.4% |
|
Special
Education Directors |
77.24 |
83.41 |
86.98 |
89.71 |
92.37 |
92.90 |
15.66 |
20.3% |
|
Title 1
Coordinators |
19.02 |
17.00 |
19.17 |
16.51 |
17.18 |
17.62 |
-1.40 |
-7.4% |
|
Vocational
Education Directors |
22.00 |
17.00 |
19.00 |
33.45 |
26.50 |
24.00 |
2.00 |
9.1% |
|
Support
Svcs - School Admin Total |
1,197.99 |
1,178.44 |
1,287.52 |
1,275.73 |
1,308.38 |
1,310.94 |
112.95 |
9.4% |
|
Support
Svcs - General Admin |
2001 |
2002 |
2003 |
2004 |
2005 |
2006 |
Change |
Change % |
|
Admin.
Asst., Clerical (2300) |
122.10 |
135.24 |
130.27 |
128.17 |
101.59 |
102.52 |
-19.58 |
-16.0% |
|
Assistant
Superintendents |
21.50 |
21.30 |
20.42 |
19.80 |
21.00 |
16.90 |
-4.60 |
-21.4% |
|
Superintendents |
59.65 |
60.25 |
59.18 |
54.90 |
59.60 |
57.73 |
-1.92 |
-3.2% |
|
Support
Svcs - General Admin Total |
203.25 |
216.79 |
209.87 |
202.87 |
182.19 |
177.15 |
-26.10 |
-12.8% |
|
Central
Support Services |
2001 |
2002 |
2003 |
2004 |
2005 |
2006 |
Change |
Change % |
|
Admin.
Asst., Clerical (2800) |
19.72 |
5.50 |
14.90 |
12.20 |
|
|
N/A |
N/A |
|
Admin.
Asst., Clerical (2500) |
132.88 |
132.20 |
117.12 |
133.20 |
170.37 |
155.81 |
22.93 |
17.3% |
|
Business
Managers |
61.85 |
64.35 |
66.15 |
72.53 |
69.15 |
64.89 |
3.04 |
4.9% |
|
In-service
Training Staff (for non-instructional personnel) |
22.00 |
2.00 |
8.00 |
0.18 |
2.50 |
4.20 |
-17.80 |
-80.9% |
|
Planning,
Research, & Development Staff |
9.90 |
21.40 |
16.30 |
34.30 |
18.10 |
15.90 |
6.00 |
60.6% |
|
Statistical
& Data Processing Staff |
40.60 |
56.22 |
55.83 |
77.04 |
103.86 |
126.38 |
85.78 |
211.3% |
|
Central
Support Services Total |
286.95 |
281.67 |
278.30 |
329.45 |
363.98 |
367.18 |
80.23 |
28.0% |
|
Function
Name |
2001 |
2002 |
2003 |
2004 |
2005 |
2006 |
Change |
Change % |
|
Student
Transportation Staff |
317.69 |
331.61 |
342.61 |
356.81 |
348.70 |
349.00 |
31.31 |
9.9% |
|
Food
Service Staff |
672.33 |
690.69 |
615.79 |
657.51 |
618.71 |
631.66 |
-40.67 |
-6.0% |
|
Maintenance
and Security |
1,045.10 |
1,076.27 |
1,082.03 |
1,099.78 |
1,130.26 |
1,165.09 |
119.99 |
11.5% |