
How do town income and property value correlate to spending?
Towns with lower-than-average income per student, property value per
student, and education taxes raised per student are far more likely
than other towns to have below average spending per pupil, as
illustrated by the series of graphs below. This analysis is based
on 2004 data, the most recent publicly available income data for towns.
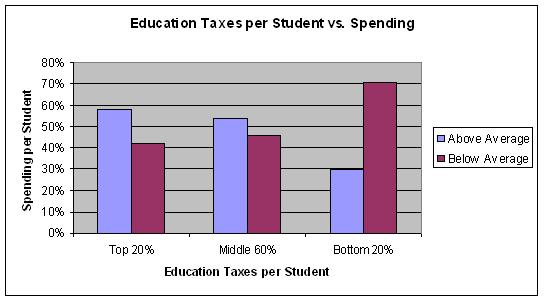
Perhaps the most interesting graph is the last one, covering taxes
raised per student vs. spending per pupil. So-called "gold towns"
(i.e. towns with high property value per student that raise far more in
tax dollars than they need to pay for their own schools) apparently
choose higher spending-per-pupil despite the very significant tax
impact. At the same time, so-called "receiving towns" (who are
most likely all in the bottom 20% of taxes per student) are 2-to-1 more
likely to spend below the state average, despite the influx of
money that they do not raise locally.
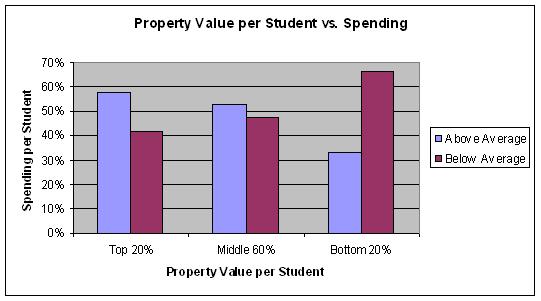
Property Value per Student
The bottom 20% of towns in terms of property value per student are
highly likely to have below average spending per student (67% vs. 46%
for all other towns). In contrast, towns in the top 20% in terms
of property value per student are somewhat more likely to have above
average spending per student (58% vs. 48% for all other towns).
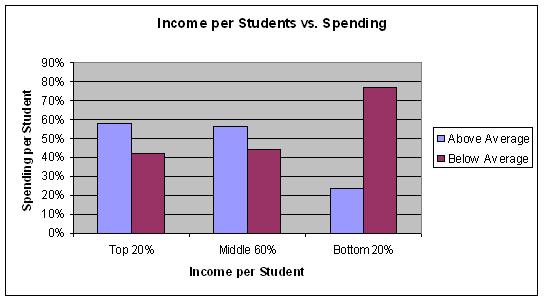
Income per Student
The bottom 20% of towns in terms of income per student are highly likely to have below average
spending per student (76% vs. 44% for all other towns). In contrast,
towns in the top 20% in terms of income per student are
somewhat more likely to have above average spending per student (58%
vs. 48% for all other towns).
Education Taxes Raised per Student
The bottom 20% of towns in terms of education taxes raised per student are highly likely to have below average
spending per student (71% vs. 45% for all other towns). In contrast,
towns in the top 20% in terms of education taxes raised per student are
somewhat more likely to have above average spending per student (58%
vs. 48% for all other towns).
Copyright (C) 2006 by Ken Dufort